Learn a Stat: Win Share
Welcome back to Hack a Stat! It’s a new chapter of Learn a Stat: let’s talk about the Win Share. Not widely used, but still interesting.
Introduction
The Win Share is one of the individual statistics that most of all makes the haters of stats angry: in a team sport, why do you want to divide the merits of a victory among the players?
Actually, this statistic tries to estimate a quantity that identifies how many wins the player has brought with his contribution to his team.
Pay attention: a possible wrong belief on this statistic is linked to the contributions in the crucial moments. Actually the Win Share is based on the seasonal numbers; scoring a buzzer-beater or blocking the opponent’s buzzer-beater does not lead to higher Win Share values. In other words, the importance of a contribution within a game is not weighed differently.
The theories behind this statistic arise from Bill James’s mind who applied them to baseball: Justin Kubatko has reviewed part of the process and adapted it to basketball. The calculations and explanations in this chapter, therefore, are taken from his study.
Definition and starting data
As already said, the Win Share is the statistic that estimates the number of victories brought to the team by a player based on his contribution. By its nature, it is a statistic based on the season totals.
One of its peculiarities is that adding all the players’ Win Share of a team, a value very close to the total team wins is obtained; being an estimate, however, the exact number will never be reached, but as long as the difference remains around 2/3 units, the calculation can be considered successful.
The Win Share is made up of two terms: the Offensive Win Share and the Defensive Win Share. As the names suggest, the first bases its calculation on the player’s offensive contributions, while the second bases on his defensive contributions. The sum of the two gives us the Win Share.
In addition, there is also the Win Share per 40 Minutes. This statistic is the distribution of the Win Share on the 40 minutes (or 48 for NBA). This value is very useful when you want to make a comparison among players belonging to different teams: in this case, it is convenient to have a relative and not absolute value (such as the Win Share).
To calculate all these terms we will need not only the player’s contributions but of course also those of the team and the entire league.
Offensive Win Share
- Points Production [PtsProd] or [PtsGen] obtained from the Individual Offensive Rating calculation;
- Total Possession Played [Poss] or [PossTot] obtained from the Individual Offensive Rating calculation;
- League Individual Points per Possession [LgPtsPoss];
- League Points per game [LgPtsPG];
- Team Pace [TmPace];
- League Pace [LgPace];
Defensive Win Share
- Individual Defensive Rating [DefRtg];
- Minutes played [MP];
- Team minutes played [TeMP];
- Opponent’s possessions [OppPoss];
- League Individual Points per Possession [LgPtsPoss];
- League Points per game [LgPtsPG];
- Team Pace [TmPace];
- League Pace [LgPace];
Win Share per 40 Minutes
- Win Share [WS];
- Games played [GP];
- Minute played [MP];
Formulas and calculation
Let’s start with the Offensive part.
Offensive Win Share
First of all, it is necessary to calculate the League value required for this calculation, that is the League Points per Possession:
n is the number of teams in the league. This value is simply the average of the League (all the teams) of the points per possession scored.
Once this is done, the next step is to calculate the Marginal Individual Offensive Contribution:
With this term, the player’s points production is decurted with the average league value considering the same number of possessions (in fact, the League value is multiplied by the player’s possessions). This term can give a negative result, meaning that the player’s contribution is less than the League’s performance; the player’s performance is counterproductive for his team.
After this, we move on to the calculation of the Marginal Points for Victory, value relative to the team:
This calculation sets the reference value to calculate the Offensive Win Share. League points per game are nothing more than the average of the points scored by each team.
In fact, it is already possible to find the Offensive Win Share with the following formula:
The player’s production is then compared with that of League to find out how important his contribution to victory is. Let’s move on to the defensive part.
Defensive Win Share
As in the previous case, two terms are calculated: the individual one and the team one.
The first is the Marginal Individual Defensive Contribution:
The purpose of this formula is to find the difference between the points allowed by the player with respect to the league average; to find this average, the first step is to identify the defensive possessions played by the player; then this result is multiplied by the difference between the League Individual Points per Possession and the points allowed by the player for each possession (the Defensive Rating divides by 100). The greater the result, the better the contribution. Therefore, it assumes a meaning contrary to the Defensive Rating, which is better when the value is low.
The second term is identical to that of the Offensive Win Share(Marginal Points for Victory).
It is already time to find the Defensive Win Share similar to what was done for the offensive part.
The Win Share will, therefore, be obtainable with the sum of the two terms found.
Finally, to find the Win Share per 40 Minutes (48 in the NBA), the following formula has to be used:
The first division allows us to find the Win Share per game, while the second part redistributes it on the 40 minutes. Obviously, the minutes will be 48 in the case of NBA players.
How to read and analyze
Analyzing the formulas it is easy to understand how the Win Share is dependent on individual Offensive and Defensive Rating. The data used are in fact part of the calculation process of Oliver’s two statistics. This involves a direct dependence between the two types of statistics: good Offensive and Defensive Rating correspond to equally good Win Shares. The peculiarity is that the Win Share compares the values with the League, thus avoiding having to compare the player’s numbers with the League averages.
Let’s move on to an example to present the data used and the calculations. We take two teams from the Italian championship (season 2017/2018) and calculate the Win Share: Trento and Reggio Emilia.
First of all, the starting data:


We take, as mentioned, the season totals and not the averages, which would give incorrect results.
The first step is to calculate the Offensive Win Share:


As can be understood from the formulas, the marginal points for victory assume the same value for all members of the team; the Marginal Individual Offensive Contribution instead assumes a greater value for the players who obviously have a higher point production. As we know, assists and offensive rebounds are considered into the Point Production, therefore with that value, all the contributions are taken into consideration and not just the points scored.
Let’s move on the Defensive part:


The DWS depends on the Defensive Rating. This stat considers not only the blocked shots, the defensive rebounds, and the steals, but also all those contributions not normally found in a box score (contested shots, forced turnovers).
Next step is to sum the two values:

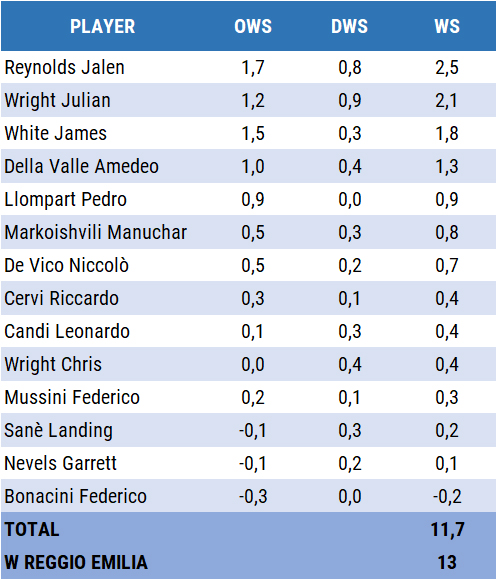
As can be seen, the sum of all the Win Shares is very similar to the victories achieved by the two teams in the regular season. Major discrepancies are noticed in teams with very few wins.
To compare the players’ Win Shares in the two tables, however, we need to look also at games played and minutes played: for example, Sutton and Reynolds have a very similar Win Share, but the second has played 5 games less.

In fact, comparing the Win Share per 40 Minutes it is noted that Reynolds has a better value than Sutton: that is to say that Jalen’s contribution per minute is higher than Dominique’s one, a result not found using the Win Share.
The Win Share is a statistic that wants to summarize in a single number the contribution to the victory: like all statistics of this type it, therefore, has limits. With a simple consultation, it is not possible to know if the added victories coming from the offensive of the defensive contributions or even a balanced mix of both.
Before concluding a quick note. The Win Share provides reliable values after many games played: the sample out of 30/34 games (the number of games played on average in Europe) is certainly reliable, but never as reliable as the NBA one based on 82 games. This fact is absolutely to be considered, in order to avoid superficial analyzes.
This Learn a Stat ends here. See you soon, your friendly neighborhood Cappe!