Learn a Stat: individual Offensive Rating
Welcome back to Hack a Stat! In this episode of Learn a Stat, we will discover the individual Offensive Rating.
Introduction
The individual Offensive Rating, created by Dean Oliver, is the player’s offensive production. Therefore, not only the points are counted, but also other contributions such as offensive rebounds and assists. So it is a total different stats compared to the Team Offensive Rating.
Each player, in fact, brings to his team various offensive contributions.
Definition and starting data
The Offensive Rating is the points generated by a single player on a basis of 100 possessions. Generated is the key term: points can be created not only by scoring but also with an assist or catching a rebound. Furthermore, possessions are considered as units of measure: we will have to calculate the possessions used by the player.
To know these two data (points generated and possessions used) we will need the following stats:
- Field goals made [FGM] and attempted [FGA];
- 3-point made [3PM];
- Free throws made [FTM] and attempted [FTA];
- Points scored [Pts];
- Assist [Ast];
- Offensive rebounds [OR];
- Turnovers [TO];
- Minutes played [MP];
Furthermore, it is necessary to know other team and opponent stats as they condition the final value of the Offensive Rating. These are:
- Team field goals made [TeFGM] and attempted [TeFGA];
- Team 3-point made [Te3PM];
- Team assist [TeAst];
- Team points scored [TePts];
- Team free throws made [TeFTM] and attempted [TeFTA];
- Team offensive rebounds [TeOR];
- Team offensive rebound percentage [TeOR%];
- Team turnovers [TeTO];
- Team minutes played [TeMP];
Let’s go to the calculation part.
Formulas and calculation
The formulas and assumptions behind the calculation of individual Offensive Rating are based on an initial consideration: the data are obtained from a normal box score.
The acquisition of data from the classic box score involves some approximations, which try to remedy the absence of some important information. Therefore, the resulting Offensive Rating is an estimate of the points generated by a player.
The final formula is the following:
As you can see it is a simple division, equal to that of the team Offensive Rating, which distributes the total points generated [PtsGen] on the total possessions played [PossTot], and then multiplies this ratio by 100. We need to know these two values: total points generated and total possessions played. For both values, some steps are required. Let’s start with the total points generated.
Total points generated
As we said before, this value depends on all the individual stats that contribute to the team scoring, even indirectly: these are the field goals made, the free throws made, the assists and the offensive rebounds. The formula can be divided into different parts that identify the values of every single contribution.
The first part takes into account field goals made:
The first part of the formula allows calculating the points scored by the field, while the second reviews the first term taking into account the shooting percentage.
The factor qAst deserves an additional discussion: it is a coefficient that takes into consideration the shots made after an assist or not, in order to assign a different weight to the two shot types. The formula for qAst is as follows:
With this formula, the percentage of shots made by a player following an assist from his teammate is estimated; it is a complex formula, created by Oliver when there was also a clear division of roles (i.e. the centers were the players with the most shots scored with the help of an assist). Today, with the position-less, this formula is a bit outdated, although still valid. If possible, it is better to consider the actual percentage of shots made after an assist. With this coefficient, Oliver tends to give less importance to the shots scored after an assist.
The second term of the total points generated is related to assists; in this case, therefore, let’s take into consideration the player’s assists:
Obviously, this value depends on the assists made; the points scored by the team are taken into account and correlated to the player’s assists.
The third term is the free throws made: the number of free throws made is added to the two previous contributions without further calculation.
The sum of these three contributions has to be multiplied by a coefficient, which takes into account the team offensive rebounds and the team offensive efficiency:
This formula introduces several new parameters: TeScPoss is the team possessions ended successfully; in other words, the possessions ended with a shot made; the formula is as follows:
The field goals are added with the free throws made, factored in order to consider the free throws that have actually concluded the possessions.
The second is TeORW, a term that takes into consideration team offensive rebounds:
As you can see, the main term is the team offensive rebounds percentage [TeOR%]; the other term, TePl%, is the same that appears in the formula for calculating the coefficient “a”:
This TePl% is the percentage of team offensive possessions concluded positively. We find the term TeScPoss at the numerator and the simplified formula for calculating possessions at the denominator.
Once the calculation of the coefficient “a” has been found, only one term remains to be calculated. The one related to offensive rebounds:
The player’s rebounds and the team ones are correlated together.
With all these data, the total points generated can be calculated:
Total possessions played
Let’s move on to the total possessions played, the second data for the calculation of the individual Offensive Rating. This value is an estimate of the possessions used by the player; it takes into account specific factors, such as team performance. As for the total points generated, this term also depends on the attempted shots, assists, attempted free throws, and offensive rebounds. In this case, the turnovers are also added. Let’s break down the formula into two parts; the first is made up of three terms and defines possessions ended successfully.
The first is part is about the field goals:
There is the qAst factor this time too, which influences the result according to the number of assisted shots scored by the player.
The second part is about the assists:
The third part is about the free throws:
These three terms are summed together and multiplied by the coefficient “a” already used for the total points generated.
In the end, we take the offensive rebounds:
All these terms together define possessions ended successfully. The total possessions, however, also include the missed shots and the turnovers. Let’s move on the second part:
In this case, offensive rebounds are taken into account, since Oliver wanted to give a different weight to a missed shot followed by an offensive rebound and a missed shot followed by a defensive rebound.
The second part is about the free throws:
Turnovers are simply added to the previous terms.
We can calculate the total possession played:
Once both terms have been obtained, it is possible to calculate the individual Offensive Rating with the formula shown at the beginning of the paragraph (also shown here for convenience).
And now some examples.
How to read and analyze
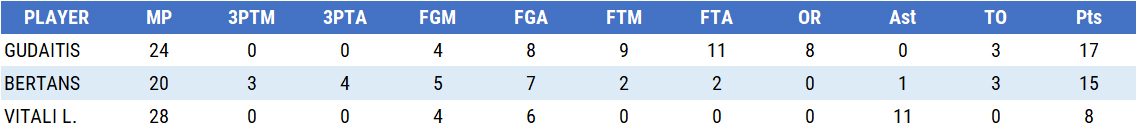
In order to have a complete view of the calculation, I have considered three player types: playmaker who makes many assists (Vitali), a big man (Gutaitis) and a pure shooter (Bertans). Here are the basic data:

The first step is to calculate the three terms dependent on team performance: team possessions ended successfully [TeScPoss], the offensive rebound weight [TeORW] and the success rate of team possessions [TePl%]:

Taking team performance into account is useful for calibrating each player’s individual performance: for example, it is possible that a player benefits from an above-average team performance and produces more than he would have done in normal conditions; or, it is also possible that a player who played a normal game stands out due to his teammates’ poor performance.
Let’s now pass to the terms relating to the total possessions played:

Let’s analyze Gudaitis and Bertans: they both shot an almost identical amount of shots from the field; however, Gudaitis has lower shooting percentages than Latvian: how will this affect? To understand this, just sum together the ScPossFG and the FGxPoss: these two values depending on the field goals show the total possessions generated by these shots.
The Lithuanian has 6.39, Bertans has 5.65: with the same number of field goals, Bertans has generated fewer possessions. This is because the sum does not give us the real number of possessions, but rather a value that also takes into account the player’s skill: the number of possessions is in the denominator in the Offensive Rating formula, so, for the same value in the numerator, the lower the number of possessions, the greater the result. Gudaitis, therefore, pays that 50% from the field and thus creates more possessions than Bertans.
Vitali, on the other hand, did not make many mistakes, but also he has taken fewer shots. His most important contribution obviously comes from assists. Of the three, he is the one with the lowest number of possessions created. An assist generates a lower possession value than a single shot. This means that in the count of total possessions played an assist gives a better contribution since it keeps the final result lower.
Let’s calculate the total points generated:

Bertans, being a shooter, produces most of his points by field goals. Gudaitis, on the other hand, creates also from free throws and offensive rebounds.
As for the term of the possessions played, also here we can see how the shooting percentage affects these terms: Bertans and Gudaitis have taken a very similar number of conclusions, but the first has made fewer mistakes. So the Latvian’s PtsGenFG is higher.
Vitali instead produced several points through his assists. An assist creates a value slightly lower than a field shot made: in other words, Oliver wants to give a slightly higher weight to the shots compared to the assists. An offensive rebound produces an even lower point value than assists.
The three players, therefore, produced similar amounts of points: how high will their Offensive Ratings be?

Bertans made fewer mistakes than Gudaitis and is more efficient than the Lithuanian; Latvian produced fewer points in absolute quantities than Lithuanian, but his value per 100 possessions is better. Vitali instead produces a lot of assists and at the same time creates the least number of possessions: he is the most effective among the three.
In the end, a quick example regarding the qAst: as mentioned in the previous paragraph, this coefficient tends to give less weight to the shots scored after an assist. However, this coefficient is a value resulting from a formula created by Oliver that tries to estimate the percentage of assisted baskets; if however, the actual number of assisted baskets can be found, it is better to use the value resulting from the ratio between this number and the total shots made. Let’s now see the formula:
The qAst value can fluctuate between 0 (no assisted shots) and 1 (all assisted shots). Suppose therefore that two players have scored the same number of field goals; the first, however, made all those shots alone, while the second with the help of his teammate. For the first the formula will be:
While for the second:
The first part of the formula will be the same due to the initial conditions (same shots made); the player who used the teammates’ passes will have a lower PtsGen value than the other one. This demonstrates how Oliver’s idea is to assign less weight to assisted shots.
This Learn a Stat ends here. See you soon, your friendly neighborhood Cappe!


